The sustained posterior negativity (SPN): An Event related potential for investigating the neural response to visual regularity
Many animals use visual symmetry to guide adaptive behaviour (Møller, 1992), and symmetry sensitivity is present in 4 month old babies (Bornstein, Ferdinandsen, & Gross, 1981) and newly hatched chicks (Mascalzoni, Osorio, Regolin, & Vallortigara, 2012). As explained in our eLife paper (Makin et al., 2022), we have been investigating human brain responses to visual symmetry since 2011. We use a well-established technique called electroencephalography (EEG) to measure Event Related Potentials (ERPs).
ERP amplitude at posterior electrodes is more negative for symmetrical than asymmetrical displays from around 220 ms post stimulus onset (Jacobsen & Höfel, 2003). This difference is called the Sustained Posterior Negativity (SPN).
SPN amplitude scales with the proportion of symmetry in symmetry + noise displays (Makin, Rampone, Morris, & Bertamini, 2020; Palumbo, Bertamini, & Makin, 2015). The SPN is generated by shape-sensitive regions in the extrastriate cortex, primarily V4 and LOC (Sasaki, Vanduffel, Knutsen, Tyler, & Tootell, 2005; Tyler et al., 2005). There is no symmetry response in V1 or V2 (Keefe et al., 2018; Kohler, Clarke, Yakovleva, Liu, & Norcia, 2016; Van Meel, Baeck, Gillebert, Wagemans, & Op de Beeck, 2019). Recently the extrastriate symmetry response has been confirmed in Macaque monkeys (Audurier et al., 2022). For reviews see Bertamini, Silvanto, Norcia, Makin, & Wagemans (2018) or Cattaneo (2017).
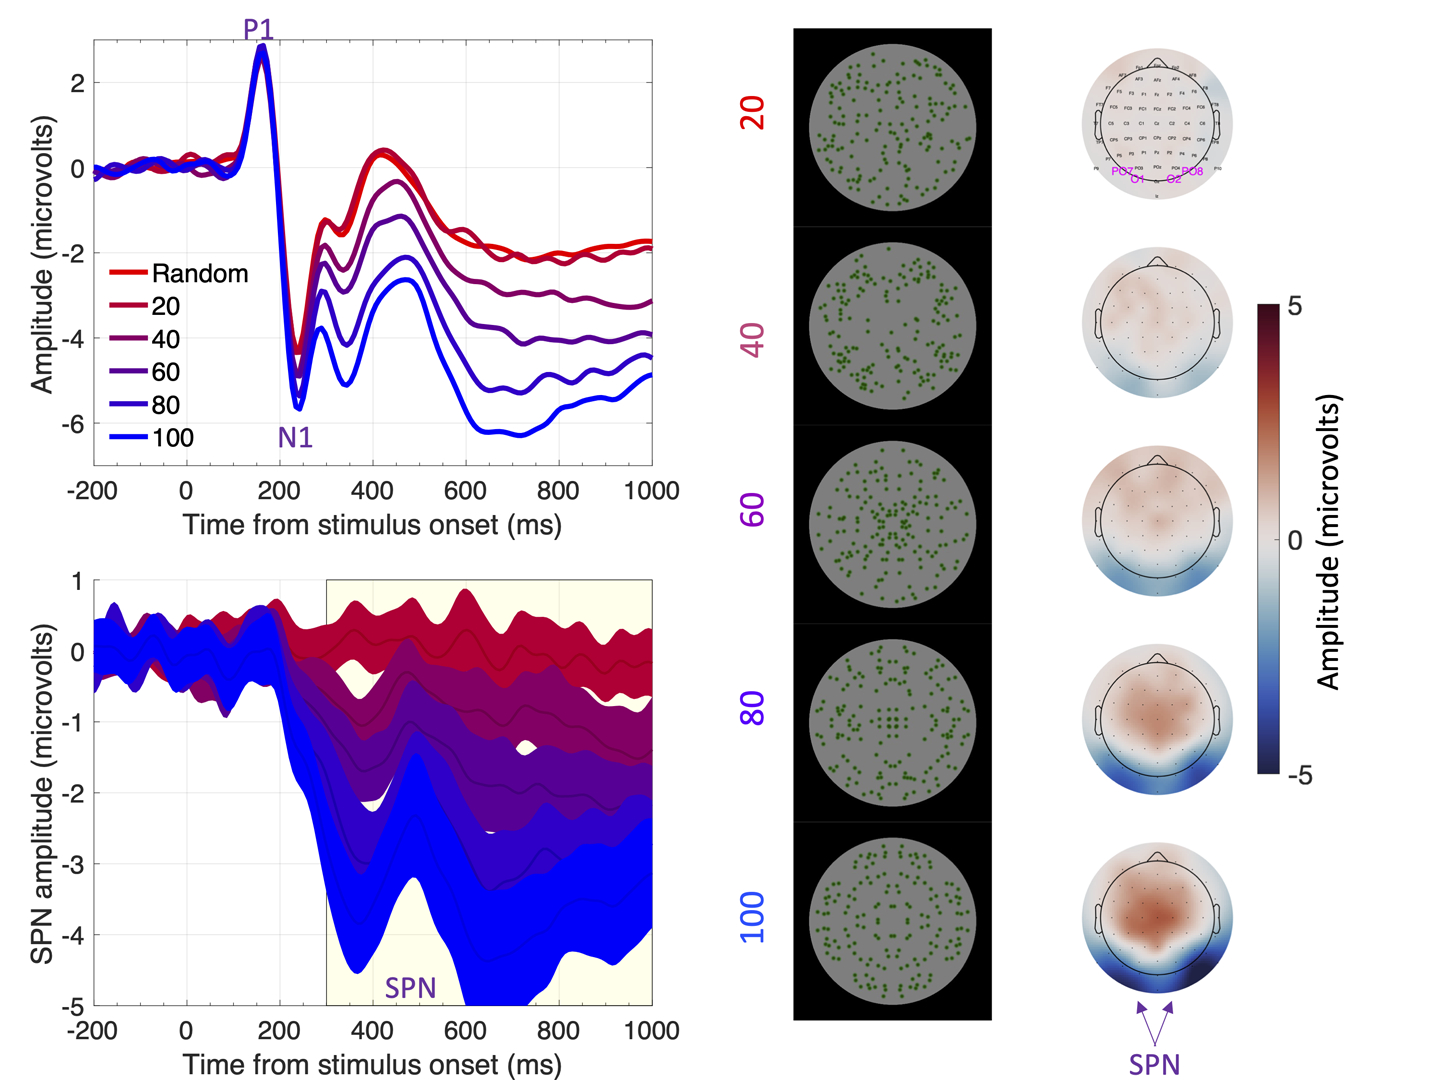
Figure 1 The sustained posterior negativity (SPN). The grand-average ERPs are shown in the upper left panel and difference waves (reflection-random) in the lower left panel. A SPN is a difference wave that falls below zero. Topographic difference maps are shown on the right, aligned with the representative stimuli (black background). The difference maps depict a head from above, and the SPN appears as blue at the back. Purple labels indicate electrodes used for ERP waves [PO7, O1, O2 and PO8]. Note that SPN amplitude increases (becomes more negative) with the proportion of symmetry in the image. In this experiment, the SPN increased from ~0 to -3.5 microvolts as symmetry increased from 20% to 100%.
SPN research supports five claims
Claim 1) The extrastriate symmetry response scales with perceptual goodness of different regularities (Confidence level = 9/10). The more salient or obvious the regularity, the larger the SPN (Makin, Rampone, Morris, et al., 2020; Makin, Rampone, Pecchinenda, & Bertamini, 2013; Makin et al., 2016; Palumbo et al., 2015; Rampone & Makin, 2020; Wright, Mitchell, Dering, & Gheorghiu, 2018). One example of this scaling can be seen in Figure 1.
Claim 2) Both hemispheres code symmetry independently (Confidence level 8/10). Symmetry presented to the left or right of central fixation generates a contralateral SPN in the opposite hemisphere (Figure 2, Makin, Tyson-Carr, Derpsch, Rampone, & Bertamini, 2021; Wright, Makin, & Bertamini, 2017).
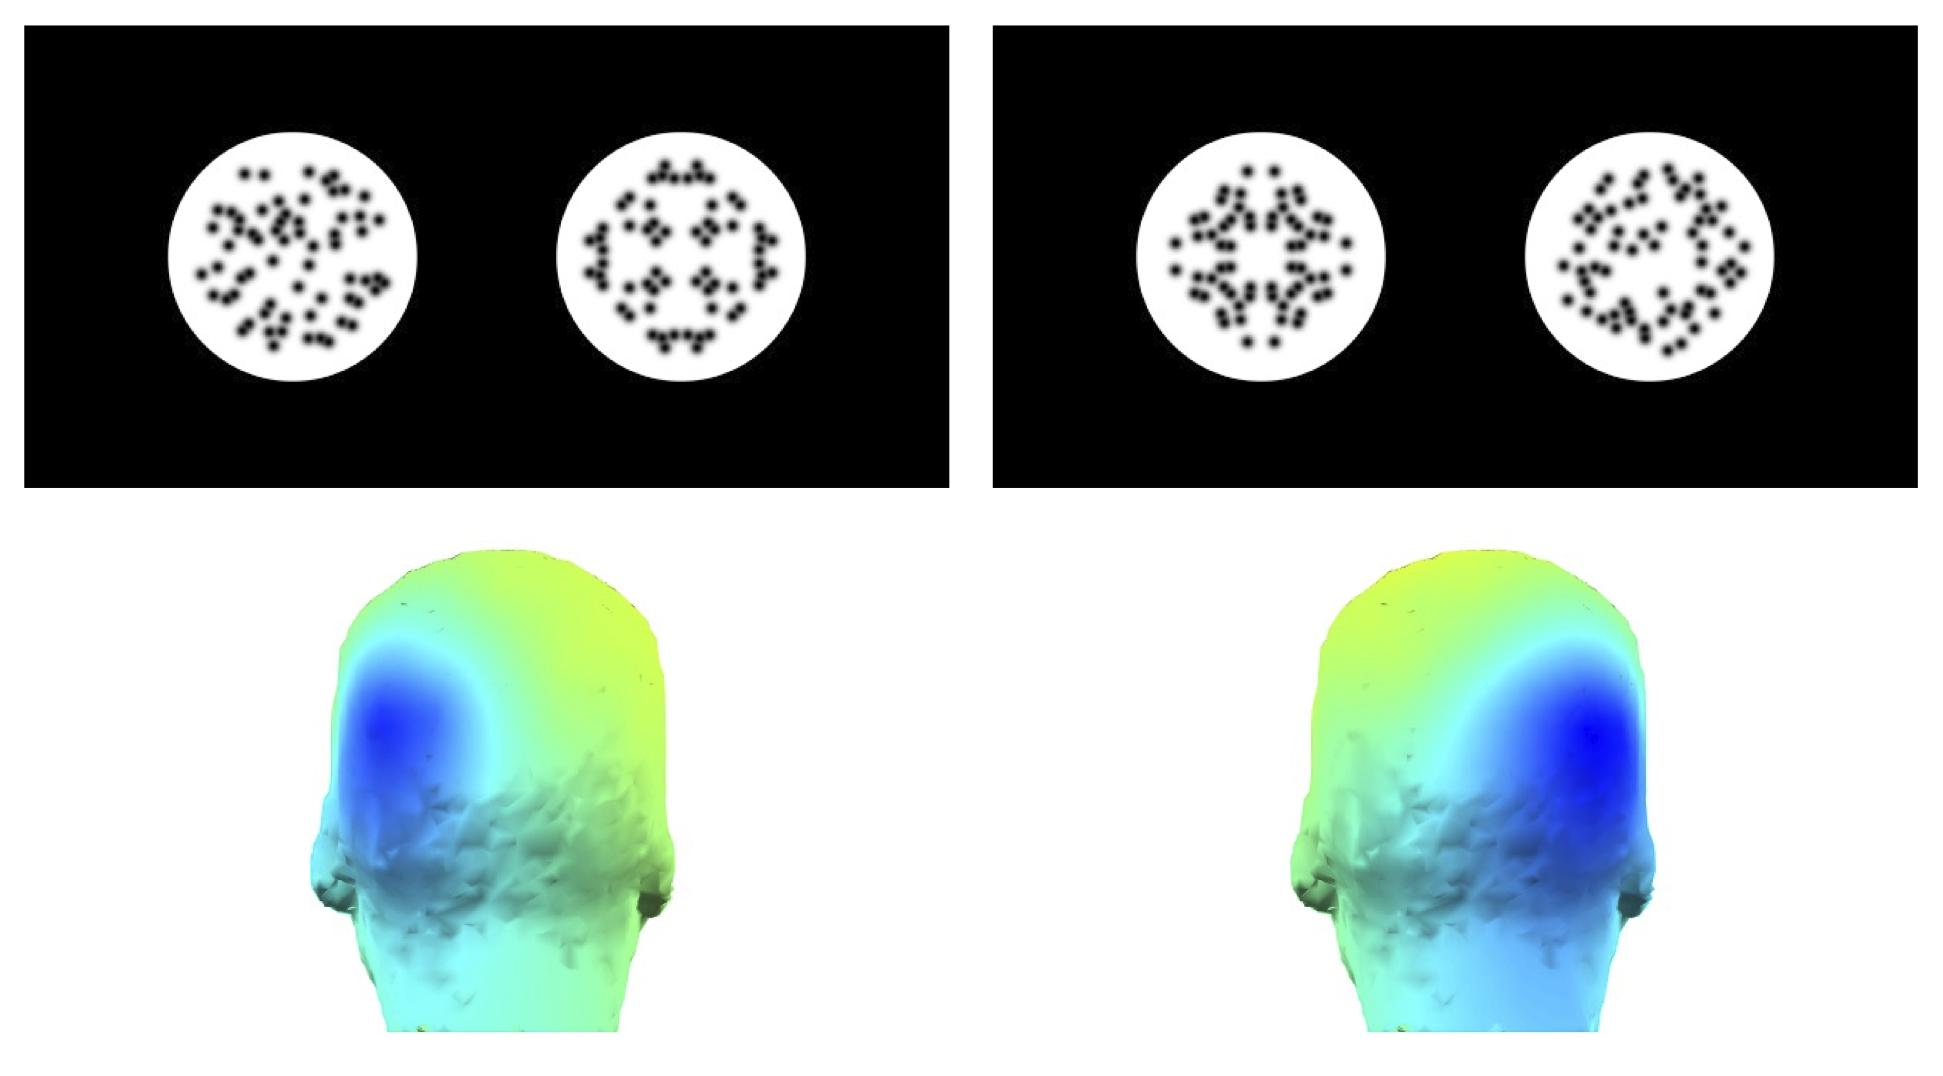
Figure 2: A contralateral SPN response.
Claim 3) Claim 3 has two parts (3a and 3b) which require some background. We can make a distinction between retinal symmetry and extraretinal symmetry. Symmetrical objects only project a symmetrical image onto the retina when viewed from arbitrary viewpoints and without occlusion (Figure 3A). Sometimes the brain can recover symmetry in objects and overcome perspective distortion and partial occlusion.
Extraretinal symmetry representations may also be called view invariant, allocentric or post-constancy representations. It is possible that the brain uses optic invariants to identify presence of symmetry across view angles, without having to construct such representations (Sawada & Pizlo, 2008).
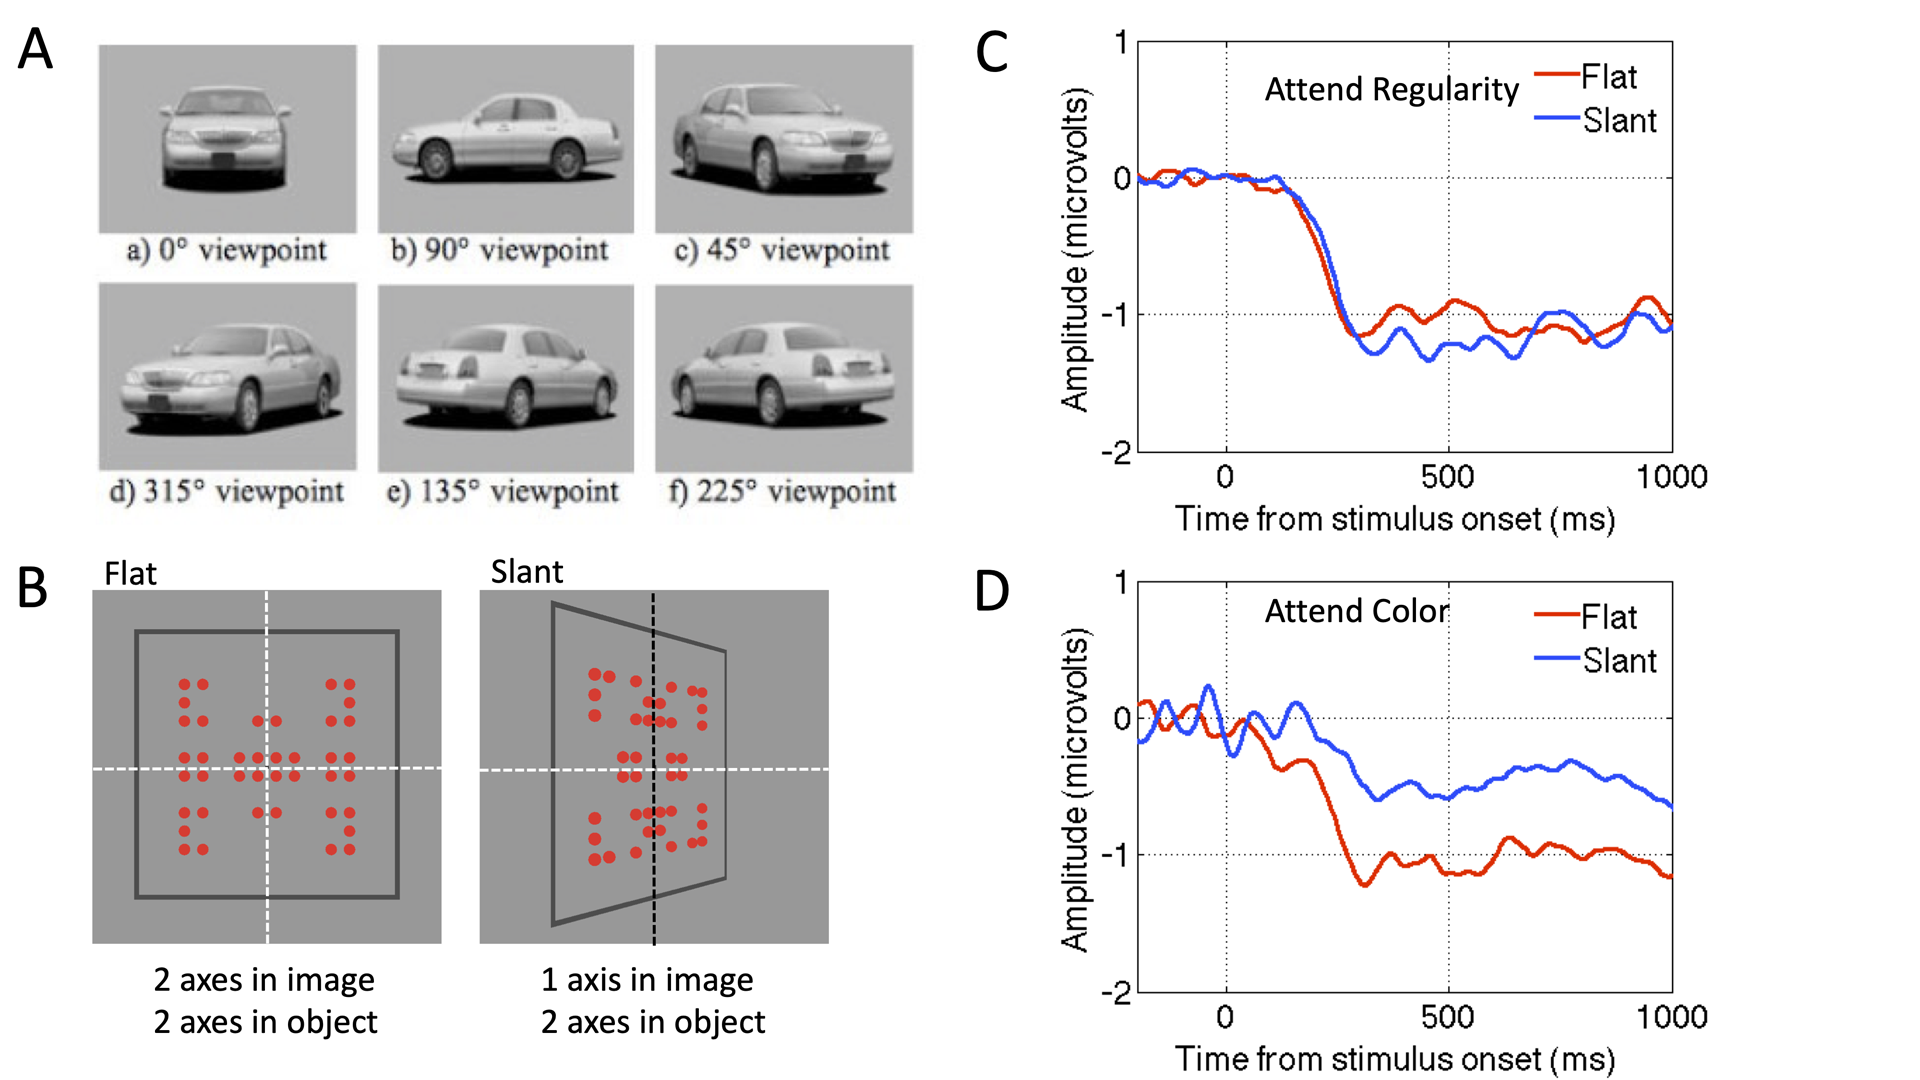
Figure 3. (A). A car is a symmetrical object, but it only projects a symmetrical image onto the retina when seen from arbitrary viewpoints (Sambul, Murayama, & Igasaki, 2013) (B) 2-fold symmetry in the frontoparallel plane or with perspective slant. Slant degrades symmetry in the image, but not in the object. (C) When attending to regularity, flat and slanted displays produce the same SPN (suggesting an extraretinal symmetry representation has been constructed). D) When attending to colour, SPN is reduced by perspective slant (suggesting a retinal-only symmetry representation is constructed). Results from Makin et al. (2015).
3a) Retinal symmetry always generates an SPN, whatever the participants task (Confidence level 8/10). (Höfel & Jacobsen, 2007; Makin, Rampone, & Bertamini, 2020b; Makin, Rampone, Karakashevska, & Bertamini, 2020; Makin, Rampone, Morris, et al., 2020; Makin et al., 2013).
3b) Extraretinal symmetry only generates an SPN when symmetry is task relevant (Confidence level 6/10). (Makin et al., 2015; Rampone, Makin, Tatlidil, & Bertamini, 2019; Rampone, Makin, Tyson-Carr, & Bertamini, 2021).
Claim 4: The extrastriate symmetry response is similar, but slightly reduced, for anti-symmetry
(confidence 8/10). Reflected elements on either side of the axis need not be matched in every way.
For instance, in one kind of anti-symmetry, black elements on one side are paired with white on
the other. Anti-symmetry generates an SPN with reduced amplitude (Figure 4, Makin, Rampone, &
Bertamini, 2020b; Makin et al., 2016; Wright et al., 2018).
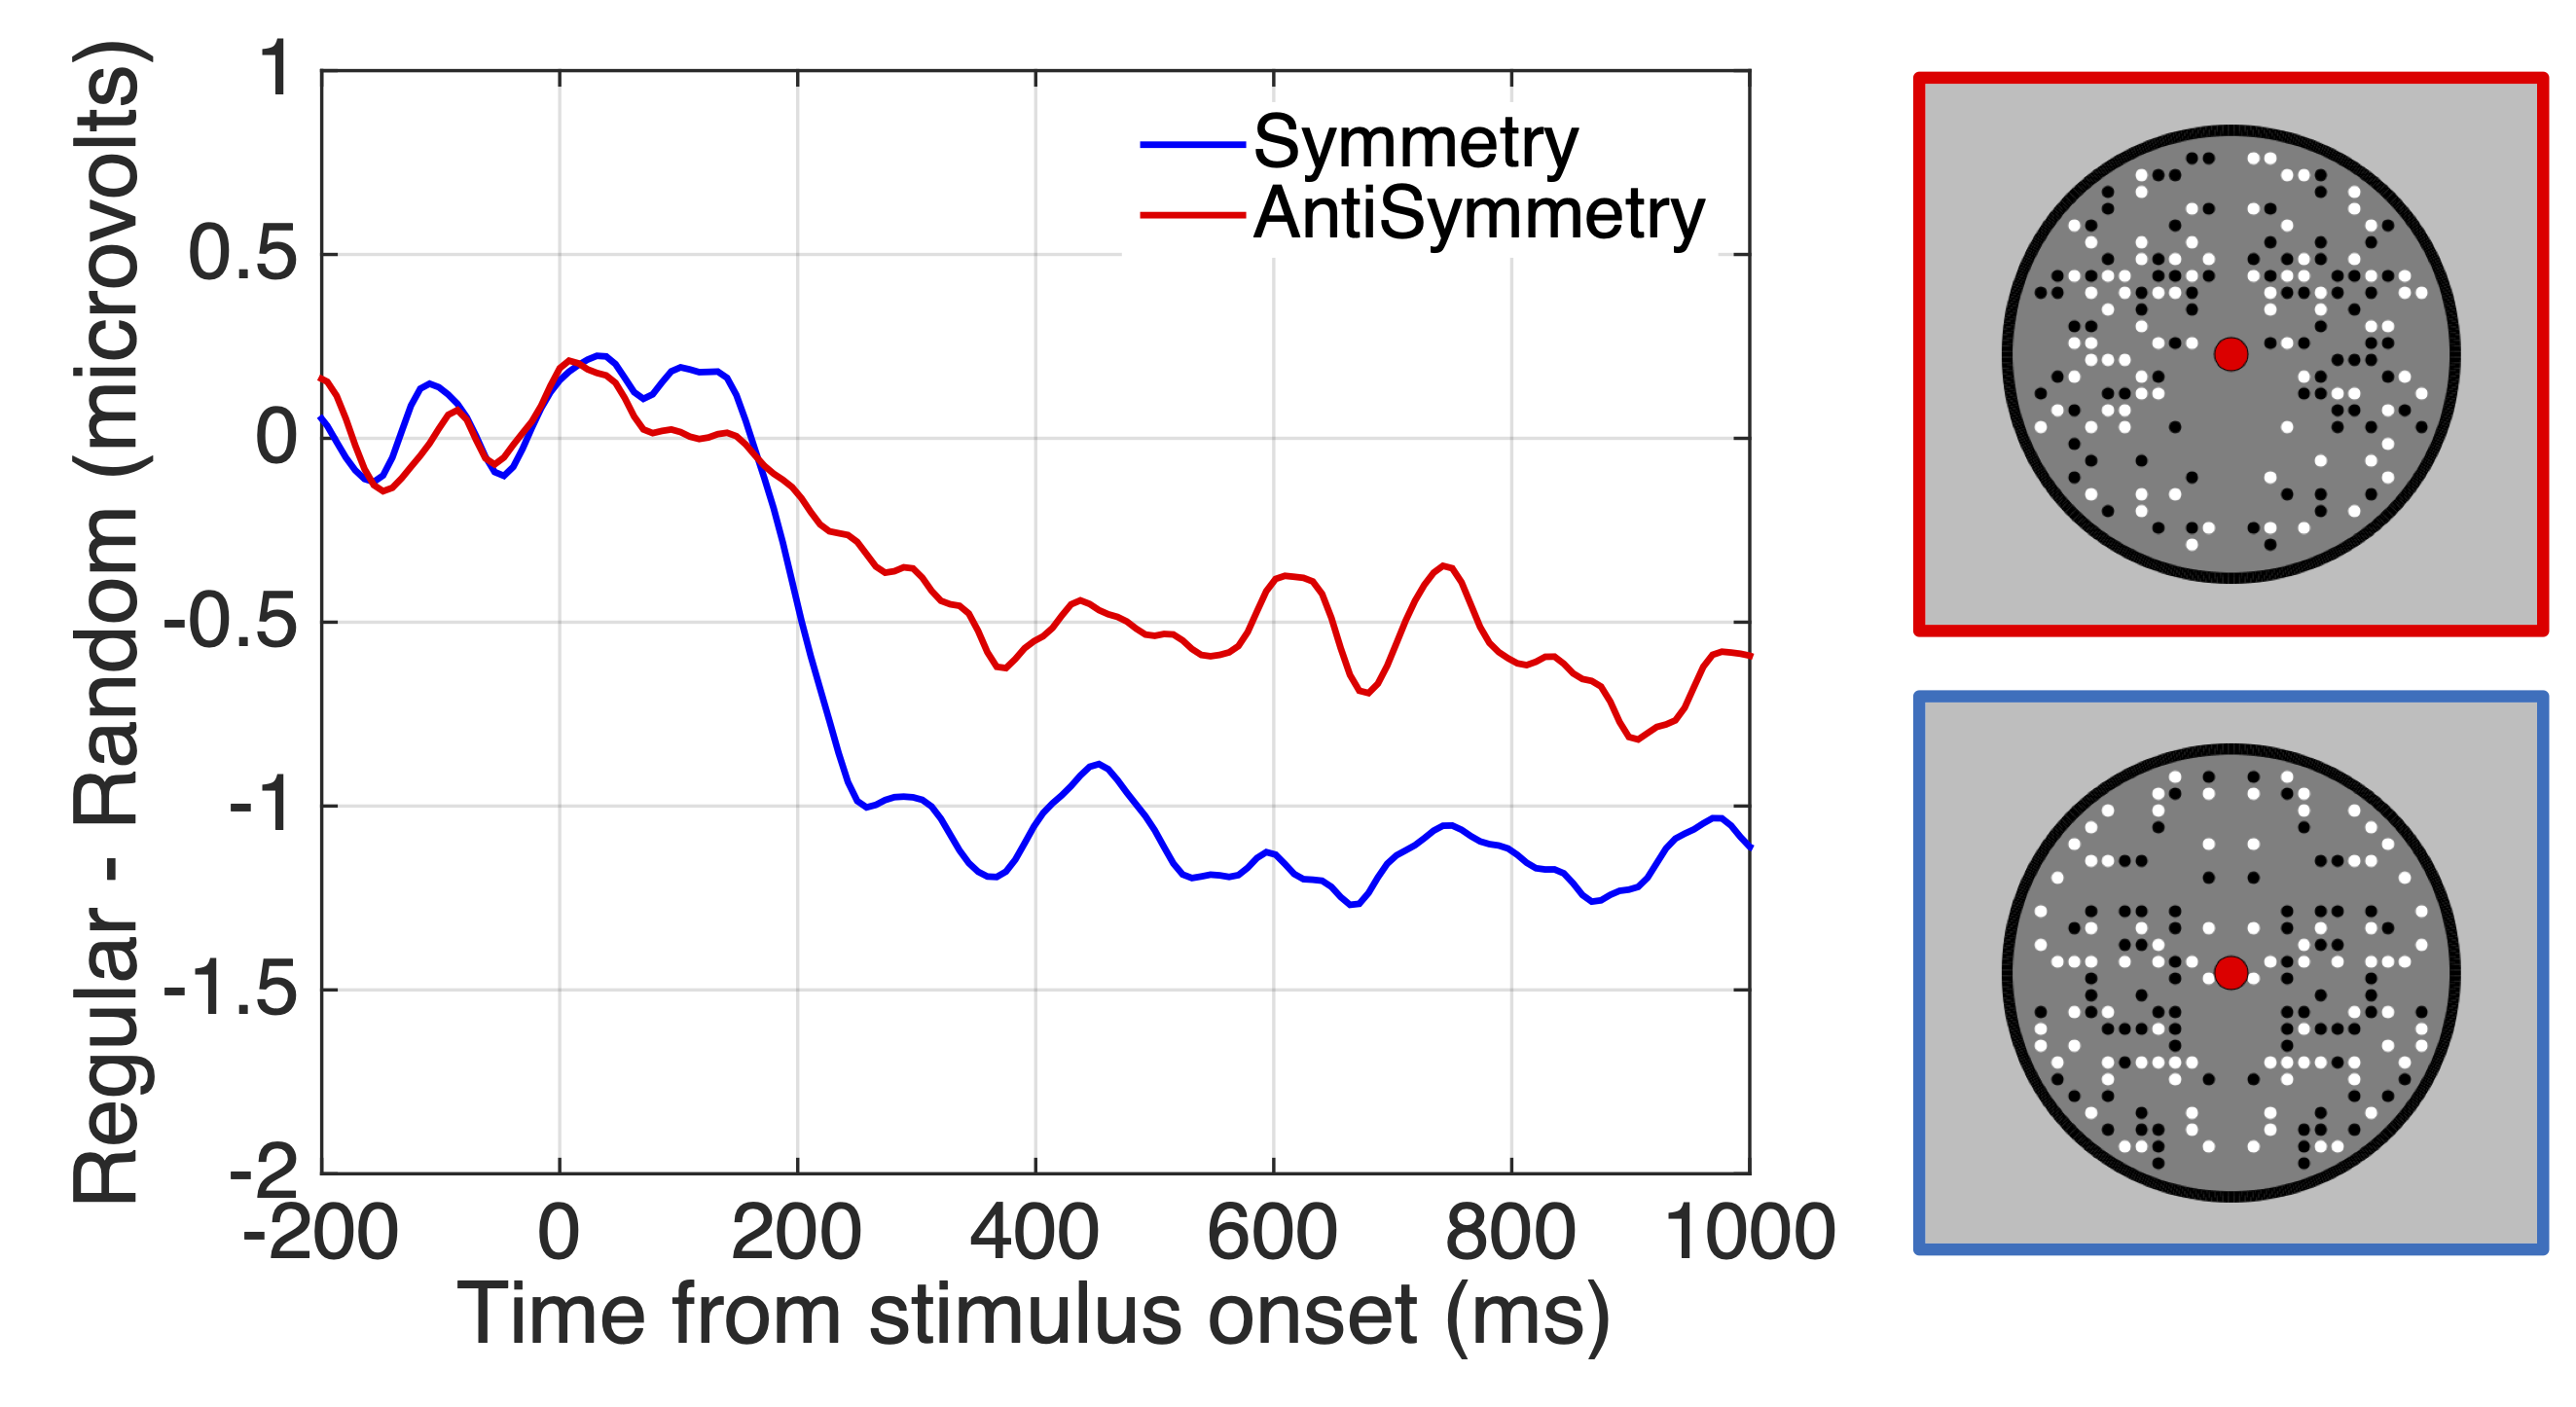
Figure 4. SPN responses to symmetry and anti-symmetry (Makin, Rampone, & Bertamini, 2020b).
Claim 5. Glass patterns generate an SPN (Confidence 9/10). There are many types of visual regularity. Glass patterns (Glass, 1969) are another kind of visual regularity (Figure 5) and they can also be used to investigate the way the brain binds local features into global representations (Wilson & Wilkinson, 1998). Glass patterns activate V4 an LOC, and generate an SPN (Makin et al., 2016; Rampone & Makin, 2020). The SPN is thus a general a response to all non-accidental spatial arrangements. A fundamental task for the visual system is to find elements (coded in small receptive fields in V1), and bind them into a meaningful gestalt, or whole (coded in extrastriate areas). When gestalt formation happens, amplitude is more negative at posterior scalp electrodes.
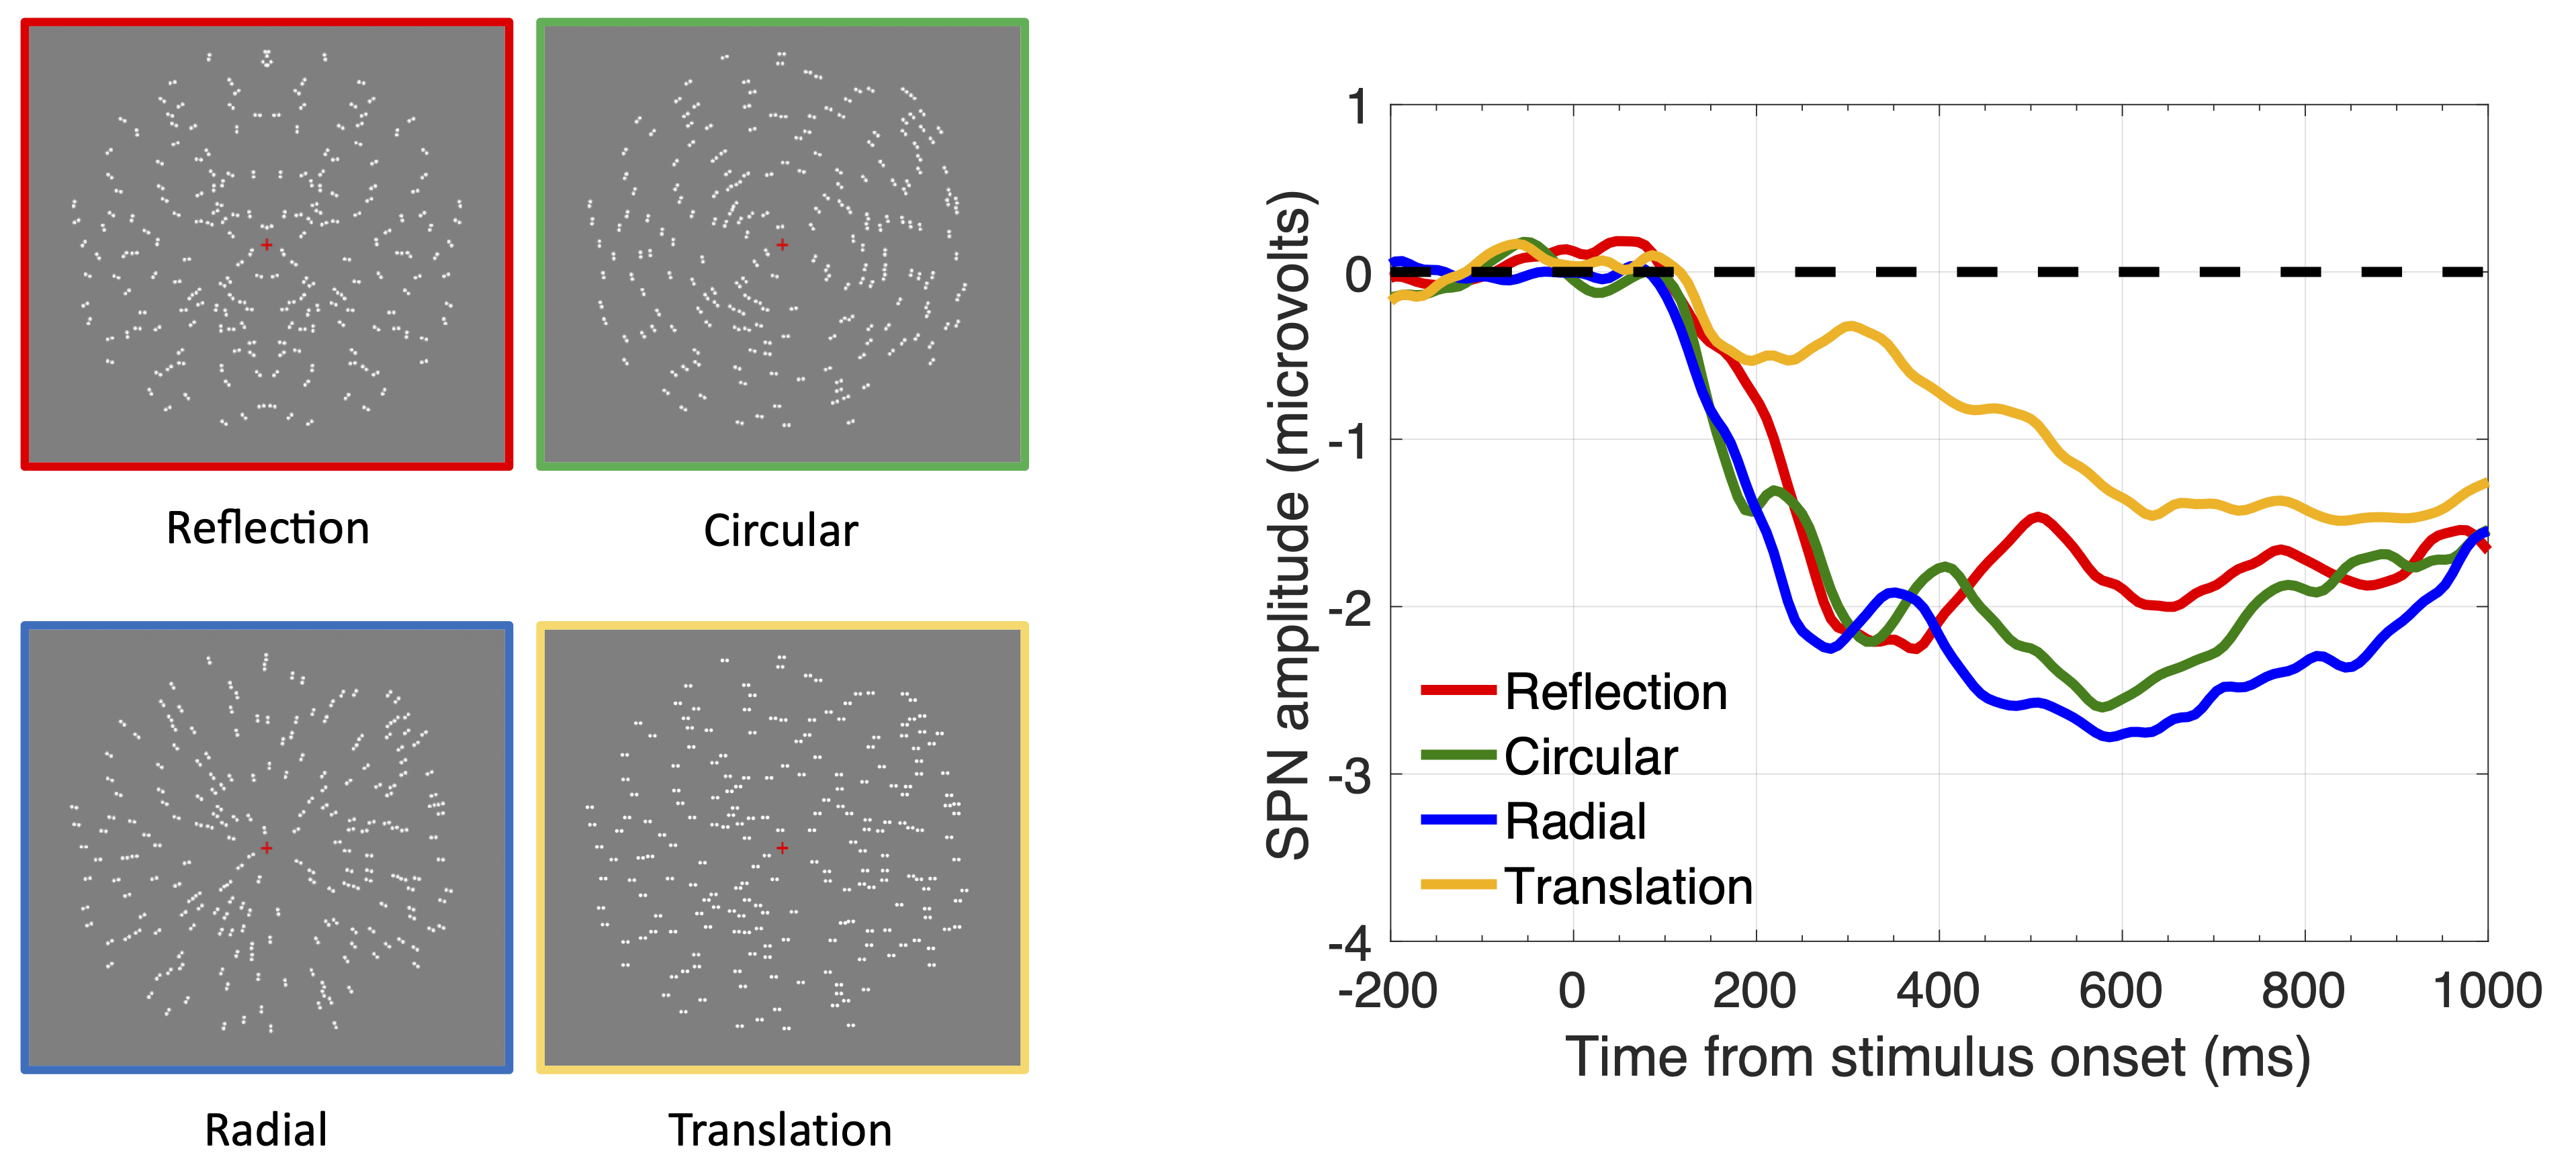
Figure 5. SPN responses to Reflection and different Glass patterns.
The Complete Liverpool SPN catalogue
Until 2020, our SPN results were disseminated in the traditional way, via published papers. However, there are well-known limitations to this approach - The published record is neither complete nor reliable (Bertamini & Munafò, 2012). At the start of the COVID pandemic EEG testing was paused indefinitely, so we took the unique opportunity to embrace superior approaches.
We collected all SPN datasets from our lab, both published and unpublished (6674 SPNs from 2215 participants) and compiled a Complete Liverpool SPN catalogue on open science framework. The SPN catalogue is designed to meet the FAIR criteria for open science (Findable, Accessible, Interoperable and Reusable). For instance, we have produced an app for easy visualization and data extraction.
Starting from a complete SPN Gallery, users find one page for each SPN. The first page from the Gallery is shown in Figure 6.
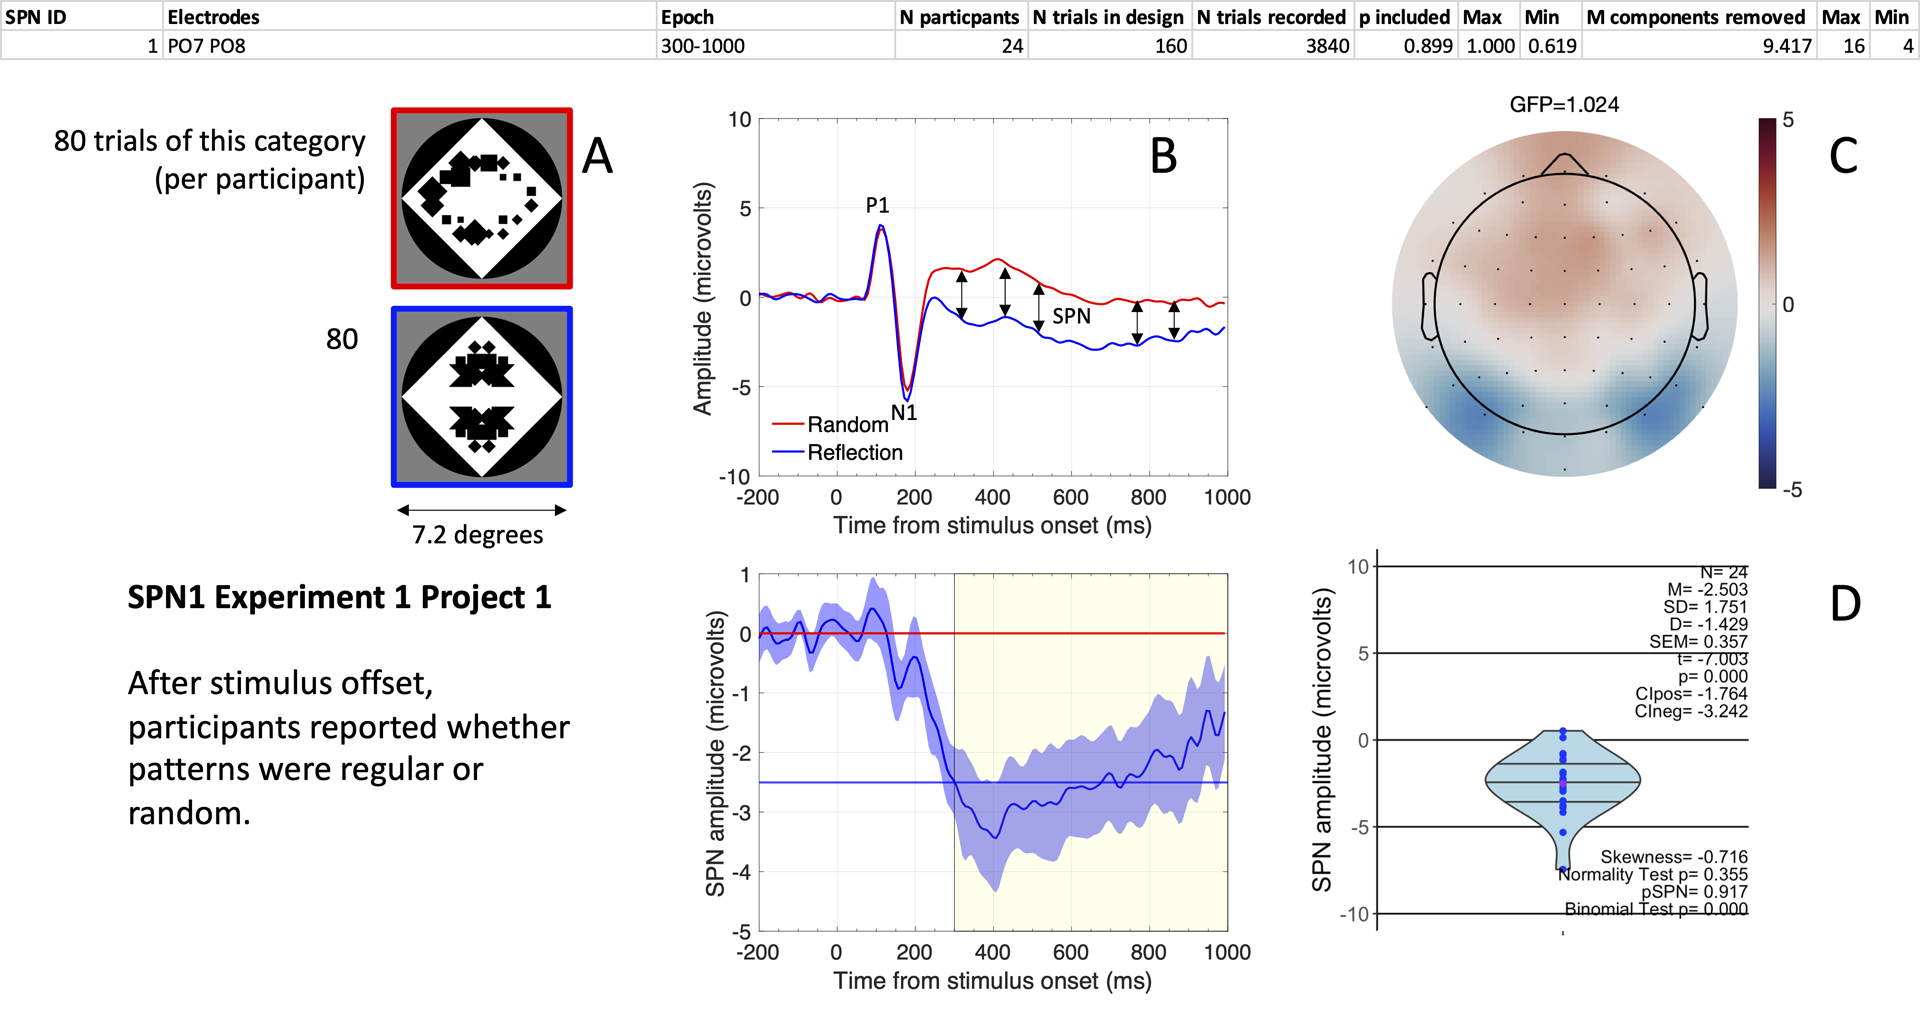
Figure 6. A typical SPN wave. (A) Examples of stimuli. (B). Grand-average ERP waves from electrodes PO7 and PO8 (upper panel), and the SPN as a reflection-random difference wave (with 95% CI; lower panel). The typical 300-1000ms window SPN is highlighted. Mean amplitude during this window was -2.503 microvolts (horizontal blue line). (C) SPN as a topographic difference map. (D) Violin plot showing SPN amplitude for each participant plus descriptive and inferential statistics.
The catalogue contains data recreating all our SPN analysis from various points of departure (beginner's guide). In most cases, raw data (BDF files) are available. We then have data at four standard stages of pre-processing. 1) Epoched data before ICA pruning; 2) Epoched data after ICA pruning; 3) Epoched data after ICA pruning and trial rejection; 4) pre-processed data averaged across trials for each participant and condition. The last stage is the starting point for most ERP visualization and reanalysis.
Scientific value of the complete Liverpool SPN catalogue.
The complete catalogue allows us to perform analysis of the whole data set and draw conclusions that would not be possible from a single experiment. Figure 7A shows a cumulative distribution of all 249 SPNs in the catalogue. Some are larger (more negative) than others. Figure 7B shows that some 33% of variance can be explained by salience of the stimuli (W score from the holographic model, Makin et al., 2016) and Task (whether participants were attending to regularity or not) both coded on a 0-1 scale (SPN (microvolts) = -1.669 W -0.416 Task +0.071). The laws of perceptual organization that determine SPN amplitude are similar in left and right hemispheres (Figure 7C and D). It is not the case, for example, that the left hemisphere cares about task and the right hemisphere only cares about global stimulus properties.
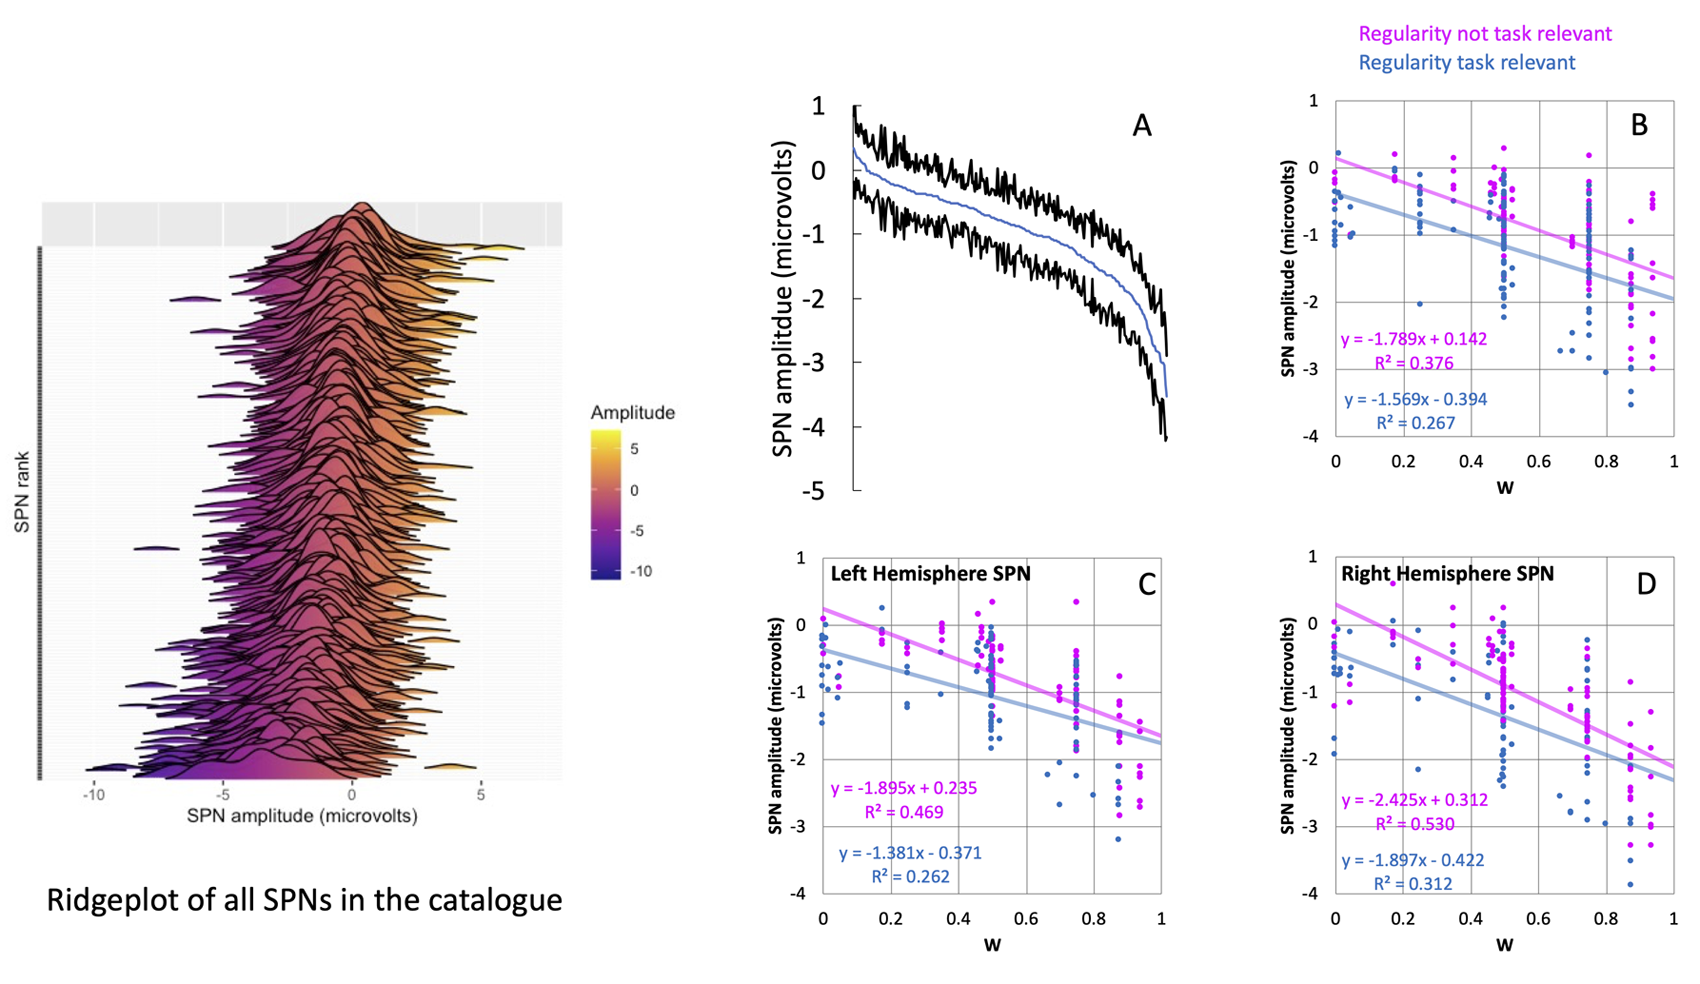
Figure 7. All SPNs as a ridge plot are shown in the left. The cumulative distribution of SPN amplitudes is shown in A. Evidently some SPNs are larger (more negative) than others. B) We can explain this variance with two predictors (W – a measure of regularity salience) and Task (whether Regularity was task-relevant or not). These predictors have a similar effect on the left hemisphere (C) and right hemisphere (D).
Tyson-Carr et al. (2021) conducted a novel analysis and found a third symmetry response in the posterior cingulate cortex, in addition to the usual two in the left and right extrastriate cortex (Figure 8). This was only present when regularity was task relevant, and when there was substantial regularity in the image (80 and 100% conditions in Figure 8). We can now test a priori predictions about which datasets in the catalogue will include a third dipole.
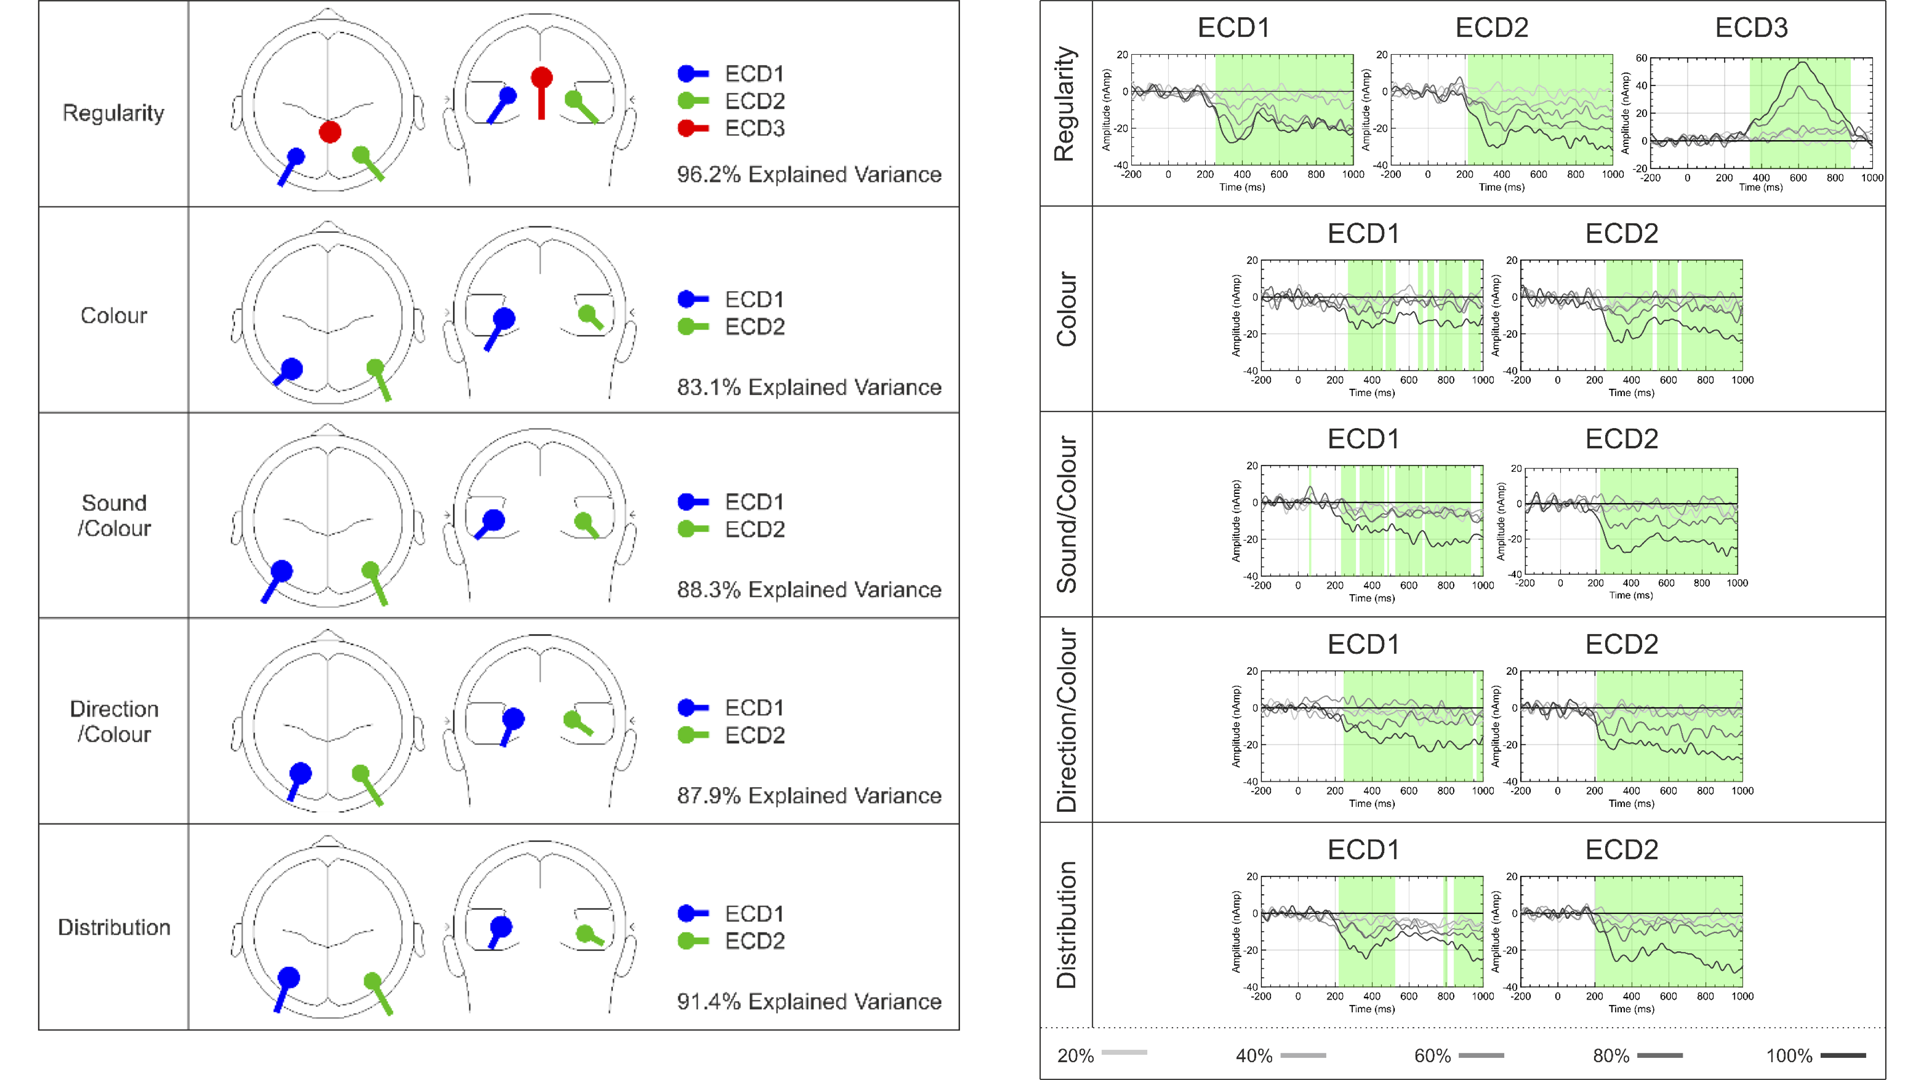
Figure 8. Approximate location of Equivalent current dipoles (ECDs) that generated SPN waves in Project 13 of the catalogue. There were 5 experiments with 5 different tasks. All tasks generated left and right dipoles, which we assume reflect the well know bilateral extrastriate symmetry response (ECD1 and 2). The regularity task also generated a third dipole in the posterior cingulate (left). The source waveform had a different time course.
Meta-scientific value of the catalogue: Are we delivering meaningful results?
The catalogue is a valuable resource for discovering new things about the brain response to symmetry. We also used the catalogue to support a meta-scientific case study on our data and practices (Makin et al., 2022). This meta-science aspect was inspired by the campaign for reproducible science (Bishop, 2019; Munafò et al., 2017) and influential studies on the replication crisis in psychology (Open Science Collaboration, 2015).
Bishop says many researchers work in a way almost guaranteed not to deliver meaningful results. They ride what she terms "the four horsemen of irreproducibility" (Publication bias, low statistical power, p-Hacking and HARKing). After reading these ominous claims one wonders whether most published research findings are false. More importantly, we wondered if these critiques apply to us. Are we delivering meaningful results, or is our research undermined by Bishop's four horsemen of irreproducibility?
Horsemen 1 - Publication bias
Published SPNs were stronger than unpublished ones. However, the SPN signal is not abolished by including file drawer studies in meta-analysis (Figure 9).
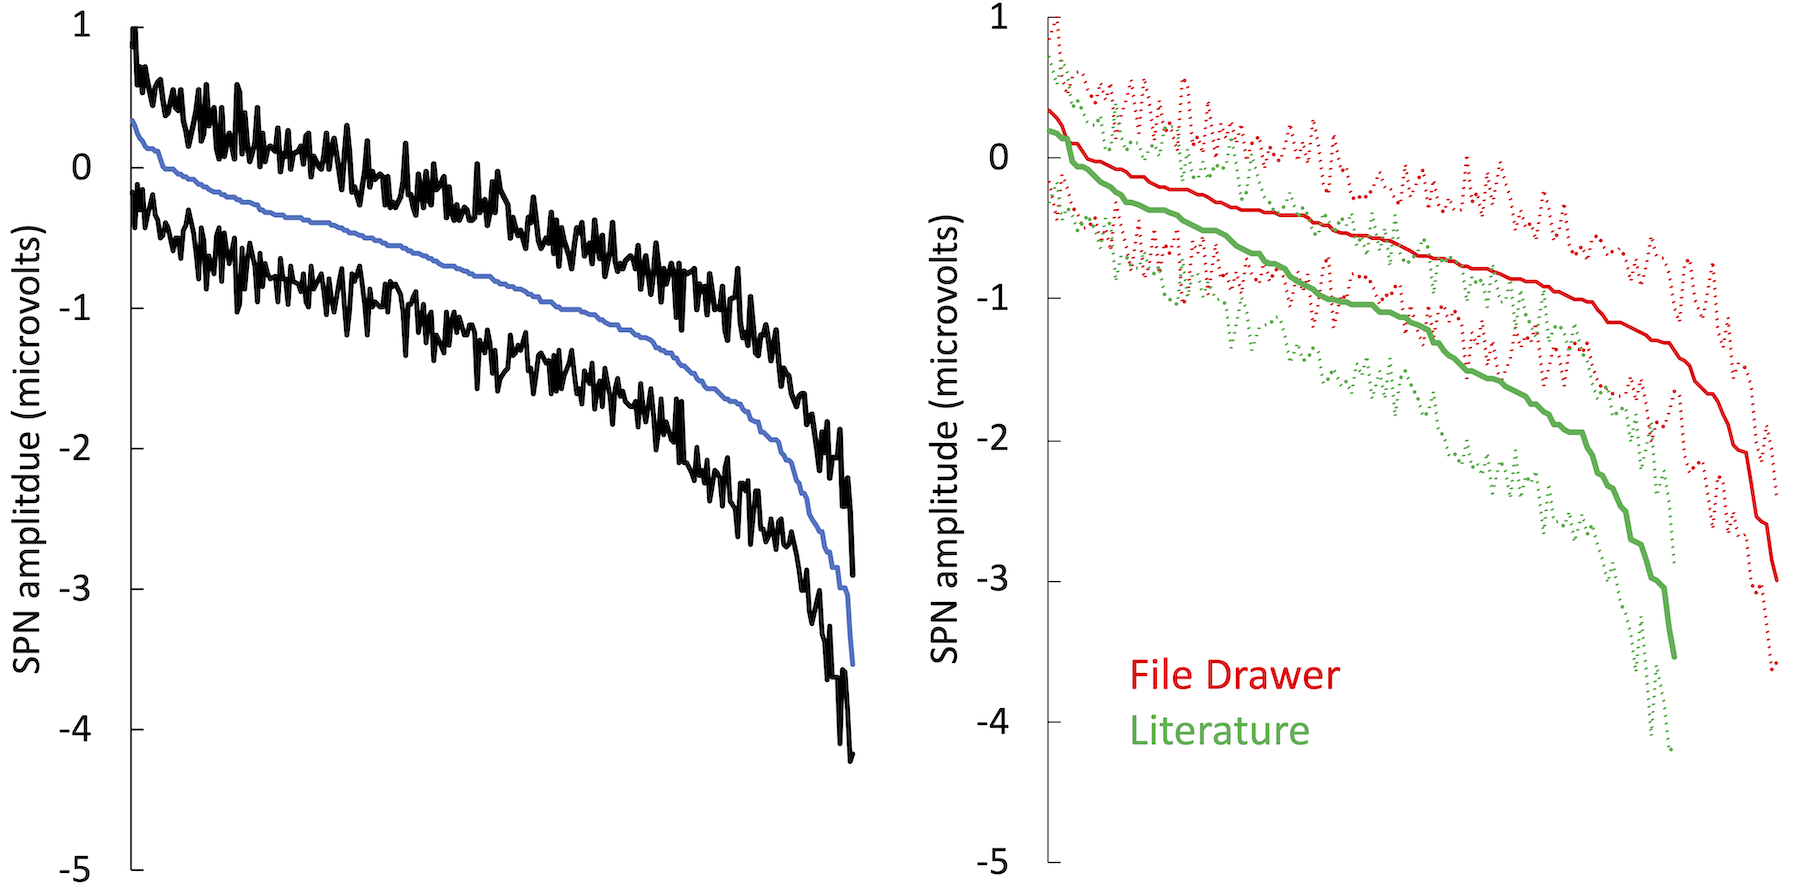
Figure 9. Cumulative distribution from Figure 7 can be divided into SPNs in the literature (green) and those in the file drawer (red). Published SPNs are larger (more negative).
Horsemen 2 - Low statistical power
Our research was underpowered when it comes to detecting small SPNs. Larger SPNs have larger effect sizes and we can estimate typical effect size for an SPN of a certain amplitude from the polynomial regression line (Figure 10). For instance, 0.5 microvolt SPNs have a typical effect size of -0.469. This requires 38 participants for an 80% power. In contrast, our typical sample is 24. Evidently, we need to increase sample size (or perhaps trial number) if we want to reliably measure significant 0.5 microvolt SPNs. At first approximation, this also applies to 0.5 microvolt differences between regular conditions, which we also often report and interpret (Makin, Rampone, & Bertamini, 2020).
It is interesting that we did not notice a power problem before. One can get by while routinely conducting underpowered research, and this may be what many cognitive neuroscientists do all the time (Button et al., 2013).
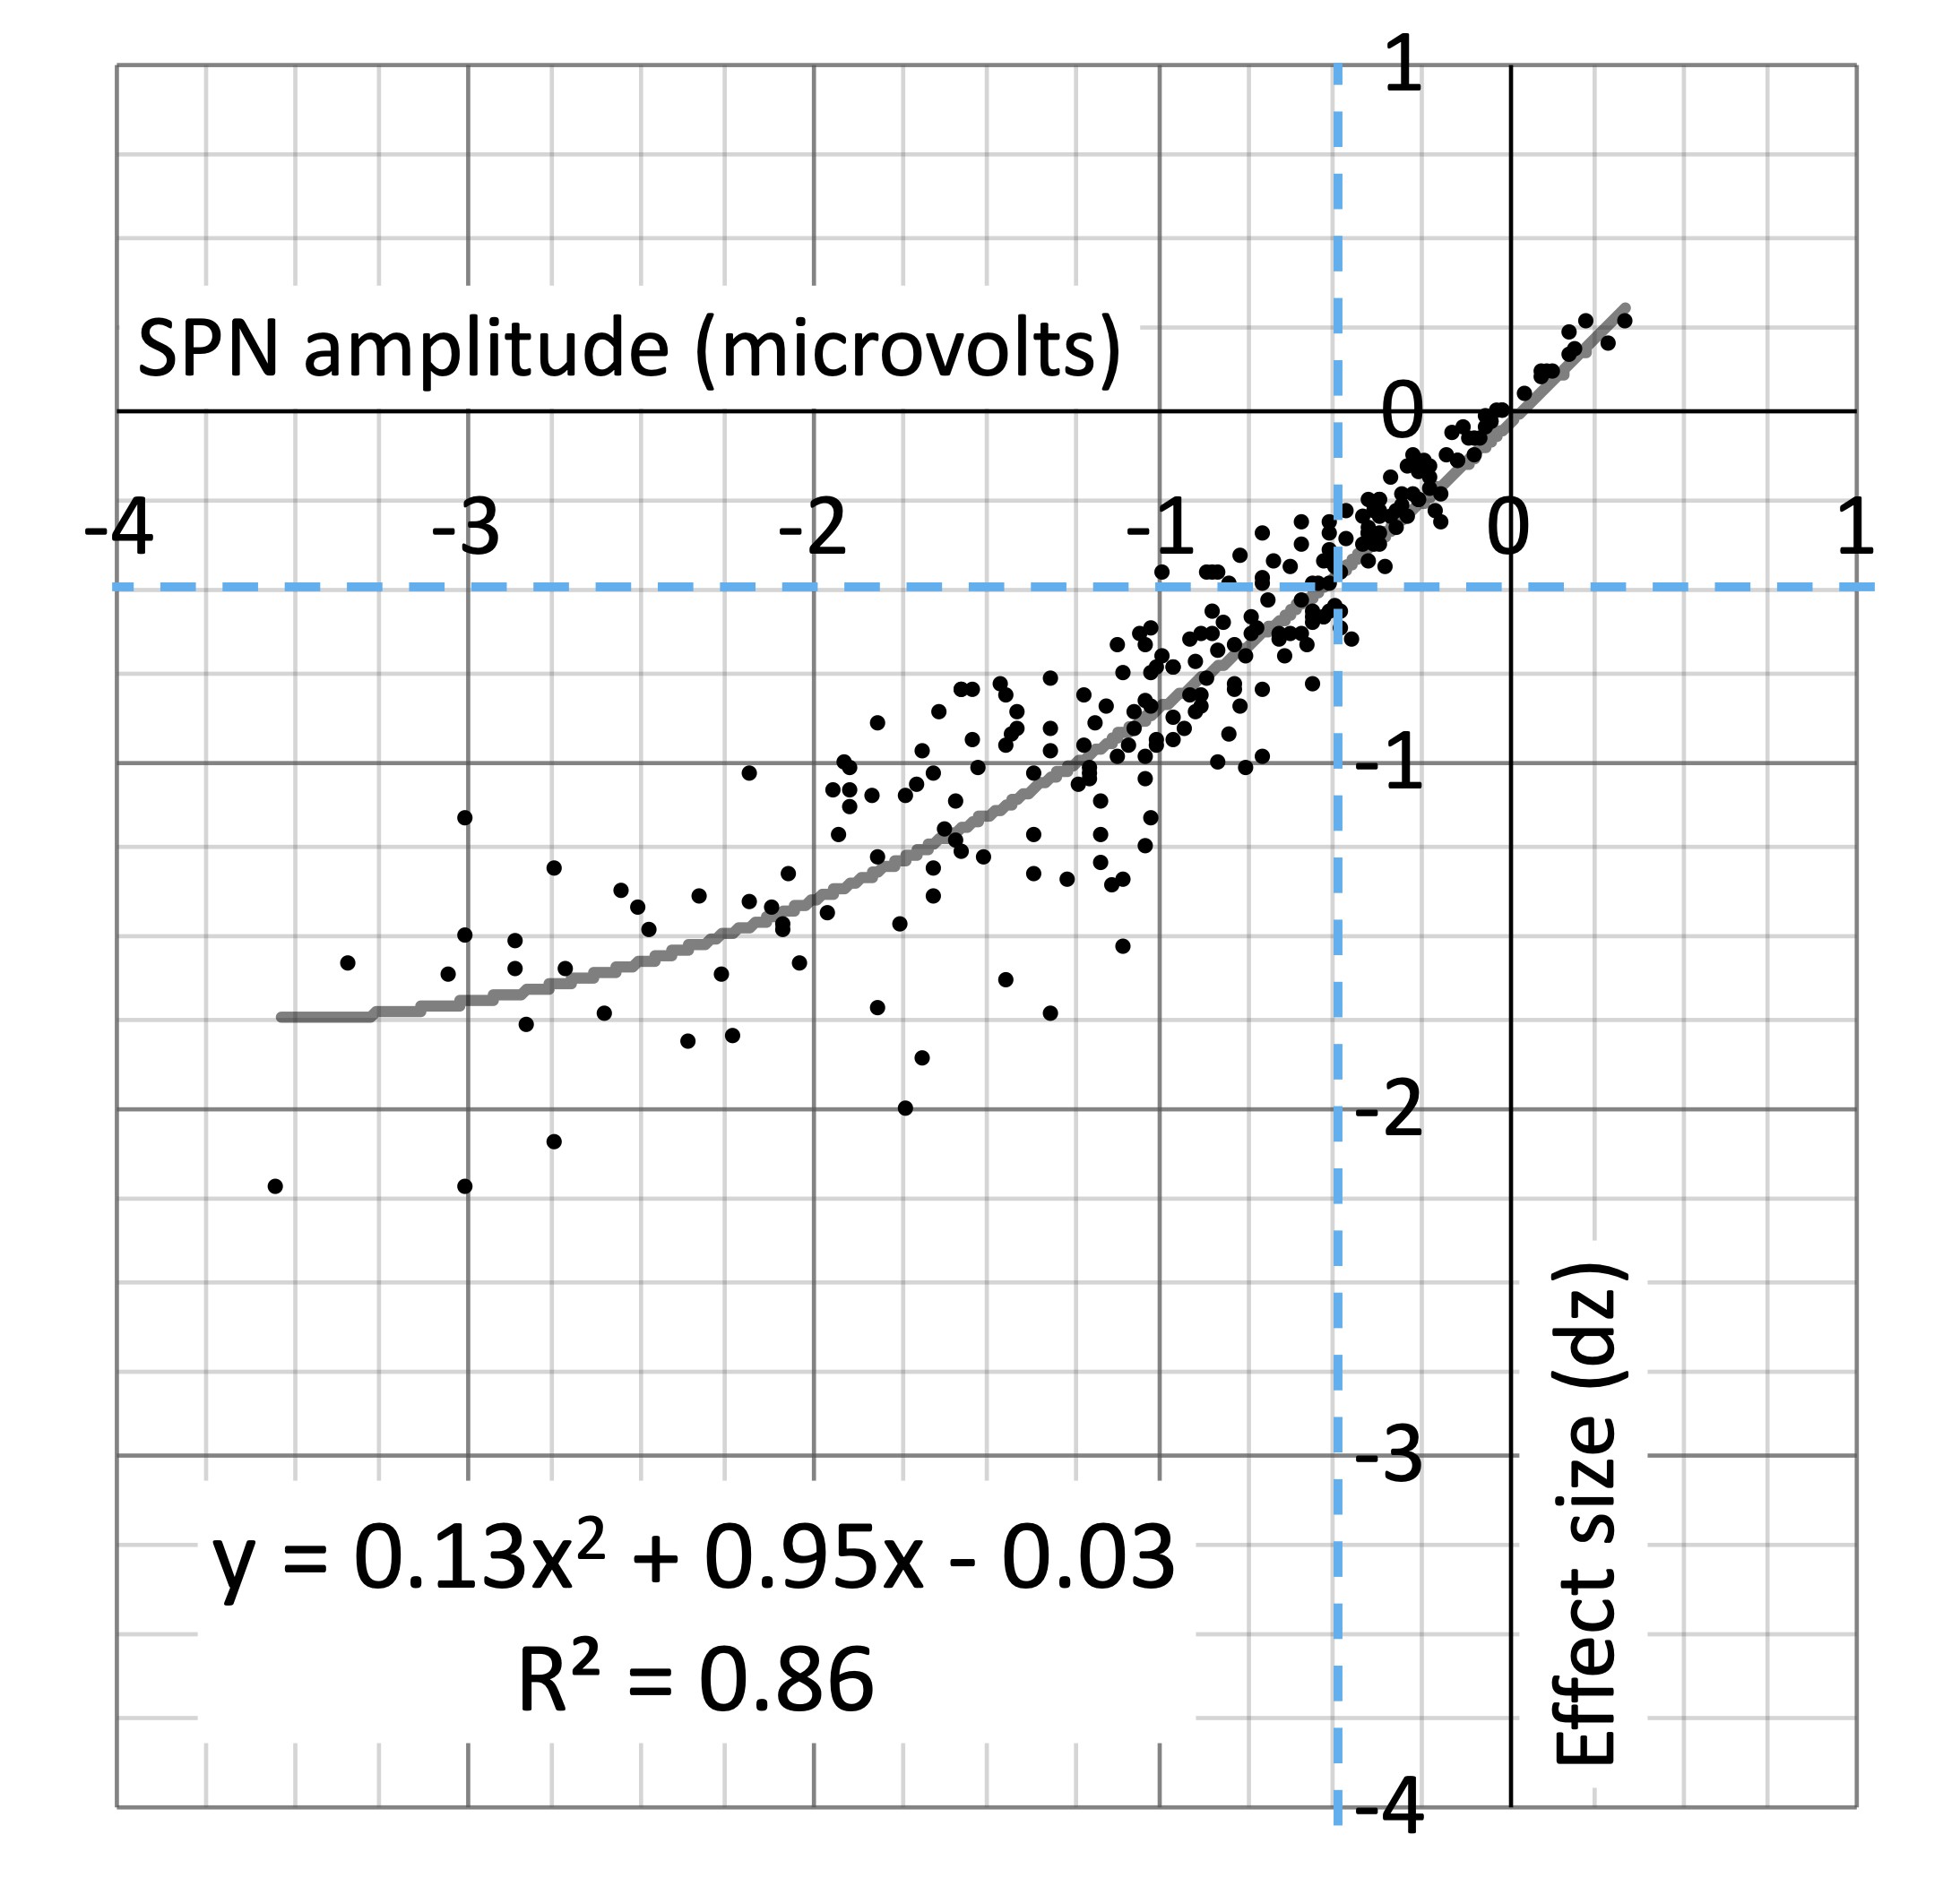
Figure 10. Scatterplot showing relationship between SPN amplitude and effect size across the 249 SPNs. Unsurprisingly, larger SPNs have large effect sizes. This relationship is best captured by the second order polynomial regression line. We can use the regression equation to estimate effect size for an SPN of a give amplitude. This can then be used in Power analysis for estimating required sample size.
Horsemen 3 - P-Hacking
P-hacking means exploiting flexibility in the analysis pipeline. P-hacking is like a performance enhancing drug for career scientists (John, Loewenstein, & Prelec, 2012). In EEG, one tempting form of P-Hacking is double dipping. One can look at data, identify where something is happening, and then conduct statistical analysis on that section alone. If the analysis is not significant, one can choose slightly different spatial and temporal parameters. We have not always used the same electrodes or time-windows. What would have happened if we had rigidly stuck with the same electrodes for every project? To find out, we reanalysed all 249 SPNs with three different clusters. It turns out the results would have been similar (Figure 11). This suggests flexible electrode choice (at this level) is not a problem in SPN research.
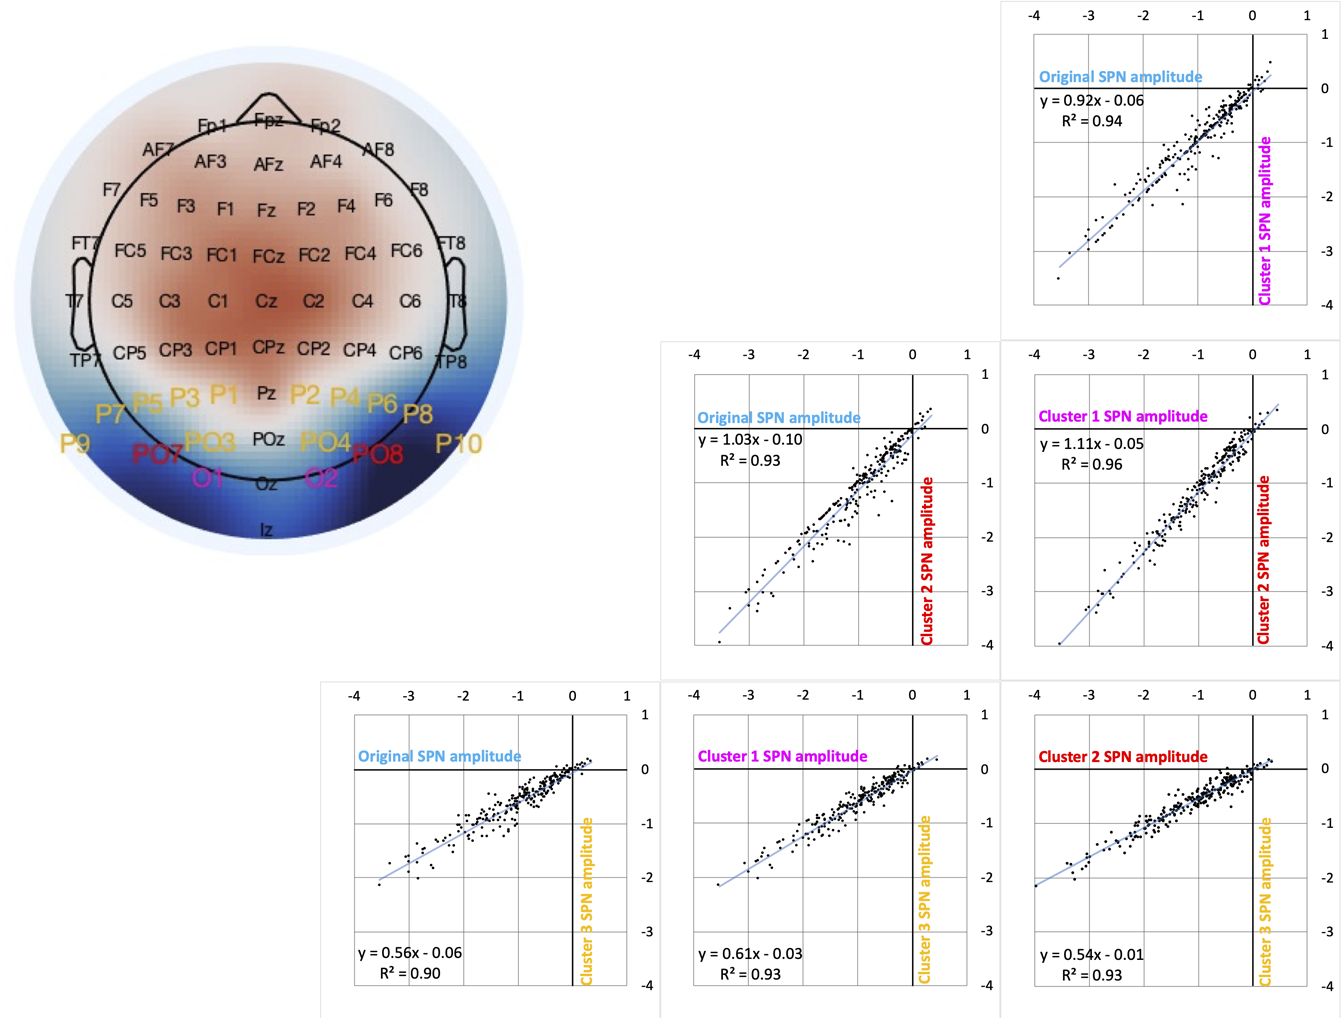
Figure 11. Vibration of the SPN effect. (A) Typical SPN topographic difference map with labels colour coded to show three alternative electrode clusters. (B) Scatterplots show SPNs from the original cluster and the three alternatives, which are highly correlated. (C) One-sample t-tests were used to establish whether each SPN is significant. The cumulative distribution of p values is shown . The smallest p (from the most significant SPN) is at the left-most end of the x axis, and the largest p (from the least significant SPN) is at the right-most end. The p values from the original cluster and the three alternatives were similar. There was a similar number of significant SPNs (169-177).
Horsemen 4 - HARKing
HARKing means Hypothesising After Results Known (Kerr, 1998). It is possible to find an unexpected effect, and then contrive a Popperian narrative where a theory predicts the observed effect, and the predictions were confirmed. HARKing is another performance enhancing drug, and used in combination with P-Hacking, it can turn noise into a theory that ends up being cited in the literature for decades. HARKing can be eliminated by routine pre-registration, and we could have engaged with this sooner.
Summary
We used the catalogue to objectively assess our research performance. We found that some strengths and some areas for improvement. We can tentatively propose a grade of A- for Publication bias, C+ for statistical power, B+ for P Hacking and B for HARKing. Even without meta-scientific self-evaluation, catalogues are an valuable resource for cumulative science. In future, researchers may see themselves as expert museum curators, who studiously update and promote their public catalogues, and make sure all data are FAIR.
We hope others will be inspired to conduct comparable catalogue-evaluate exercises. As we say in the eLife paper, we cannot just let others snoop through the window, we must actively look in the mirror.
References
- Audurier, P., Héjja-Brichard, Y., De Castro, V., Kohler, P. J., Norcia, A. M., Durand, J.-B., & Cottereau, B. R. (2022). Symmetry Processing in the Macaque Visual Cortex. Cerebral Cortex, 32(10). 10.1093/cercor/bhab358
- Bertamini, M., & Munafò, M. R. (2012). Bite-size science and its undesired side effects. Perspectives on Psychological Science, 7(1), 67-71. 10.1177/1745691611429353
- Bertamini, M., Silvanto, J., Norcia, A. M., Makin, A. D. J., & Wagemans, J. (2018). The neural basis of visual symmetry and its role in mid- and high-level visual processing. Annals of the New York Academy of Sciences, 1426(1), 111-126. 10.1111/nyas.13667
- Bishop, D. (2019). Rein in the four horsemen of irreproducibility. Nature, 568(7753), 435-435. 10.1038/d41586-019-01307-2
- Bornstein, M. H., Ferdinandsen, K., & Gross, C. G. (1981). Perception of symmetry in infancy. Developmental Psychology, 17(1), 82-86. 10.1037/0012-1649.17.1.82
- Button, K. S., Ioannidis, J. P. A., Mokrysz, C., Nosek, B. A., Flint, J., Robinson, E. S. J., & Munafò, M. R. (2013). Power failure: Why small sample size undermines the reliability of neuroscience. Nature Reviews Neuroscience, 14(5), 365-376. 10.1038/nrn3475
- Cattaneo, Z. (2017). The neural basis of mirror symmetry detection: a review. Journal of Cognitive Psychology, 29(3), 259-268. 10.1080/20445911.2016.1271804
- Jacobsen, T., & Höfel, L. (2003). Descriptive and evaluative judgment processes: Behavioral and electrophysiological indices of processing symmetry and aesthetics. Cognitive Affective & Behavioral Neuroscience, 3(4), 289-299. 10.3758/CABN.3.4.289
- John, L. K., Loewenstein, G., & Prelec, D. (2012). Measuring the prevalence of questionable research practices with incentives for truth telling. Psychological Science, 23(5), 524-532. 10.1177/0956797611430953
- Keefe, B. D., Gouws, A. D., Sheldon, A. A., Vernon, R. J. W., Lawrence, S. J. D., McKeefry, D. J., & Morland, A. B. (2018). Emergence of symmetry selectivity in the visual areas of the human brain: fMRI responses to symmetry presented in both frontoparallel and slanted planes. Human Brain Mapping, 39(10), 3813-3826. 10.1002/hbm.24211
- Kohler, P. J., Clarke, A., Yakovleva, A., Liu, Y., & Norcia, A. M. (2016). Representation of maximally regular textures in human visual cortex. Journal of Neuroscience, 36(3), 714-729. 10.1523/JNEUROSCI.2962-15.2016
- Makin, A. D. J., Rampone, G., & Bertamini, M. (2020). Symmetric patterns with different luminance polarity (anti-symmetry) generate an automatic response in extrastriate cortex. European Journal of Neuroscience, 51(3). 10.1111/ejn.14579
- Makin, A. D. J., Rampone, G., Morris, A., & Bertamini, M. (2020). The formation of symmetrical gestalts is task independent, but can be enhanced by active regularity discrimination. Journal of Cognitive Neuroscience, 32(2), 353-366. 10.1162/jocn_a_01485
- Makin, A. D. J., Tyson-Carr, J., Rampone, G., Derpsch, Y., Wright, D., & Bertamini, M. (2022). Meta Research: Lessons from a catalogue of 6674 brain recordings. ELife, 11, e66388.
- Mascalzoni, E., Osorio, D., Regolin, L., & Vallortigara, G. (2012). Symmetry perception by poultry chicks and its implications for three-dimensional object recognition. Proceedings of the Royal Society B-Biological Sciences, 279(1730), 841-846. 10.1098/rspb.2011.1486
- Møller, A. P. (1992). Female Swallow Preference For Symmetrical Male Sexual Ornaments. Nature, 357(6375), 238-240. 10.1038/357238a0
- Munafò, M., Nosek, B. A., Bishop, D. V. M., Button, K. S., Chambers, C. D., Percie Du Sert, N., … Ioannidis, J. P. A. (2017). A manifesto for reproducible science. Nature Human Behaviour. 10.1038/s41562-016-0021
- Open Science Collaboration. (2015). Estimating the reproducibility of psychological science. Science, 349(6251), aac4716. 10.1126/science.aac4716
- Palumbo, L., Bertamini, M., & Makin, A. D. J. (2015). Scaling of the extrastriate neural response to symmetry. Vision Research, 117, 1-8. 10.1016/j.visres.2015.10.002
- Sasaki, Y., Vanduffel, W., Knutsen, T., Tyler, C. W., & Tootell, R. (2005). Symmetry activates extrastriate visual cortex in human and nonhuman primates. Proceedings of the National Academy of Sciences of the United States of America, 102(8), 3159-3163. 10.1073/pnas.0500319102
- Sawada, T., & Pizlo, Z. (2008). Detection of skewed symmetry. Journal of Vision, 8(5), 1-18. 10.1167/8.5.14
- Tyler, C. W., Baseler, H. A., Kontsevich, L. L., Likova, L. T., Wade, A. R., & Wandell, B. A. (2005). Predominantly extra-retinotopic cortical response to pattern symmetry. NeuroImage, 24(2), 306-314. 10.1016/j.neuroimage.2004.09.018
- Tyson-Carr, J., Bertamini, M., Rampone, G., & Makin, A. (2021). Source dipole analysis reveals a new brain response to visual symmetry. Scientific Reports, 11(1). 10.1038/s41598-020-79457-x
- Van Meel, C., Baeck, A., Gillebert, C. R., Wagemans, J., & Op de Beeck, H. P. (2019). The representation of symmetry in multi-voxel response patterns and functional connectivity throughout the ventral visual stream. NeuroImage, 191, 216-224. 10.1016/j.neuroimage.2019.02.030
- Wilson, H. R., & Wilkinson, F. (1998). Detection of global structure in Glass patterns: Implications for form vision. Vision Research, 38(19), 2933-2947. 10.1016/S0042-6989(98)00109-6
- Wright, D., Makin, A. D. J., & Bertamini, M. (2017). Electrophysiological responses to symmetry presented in the left or in the right visual hemifield. Cortex, 86, 93-108. 10.1016/j.cortex.2016.11.001
- Wright, D., Mitchell, C., Dering, B. R., & Gheorghiu, E. (2018). Luminance-polarity distribution across the symmetry axis affects the electrophysiological response to symmetry. NeuroImage, 173, 484-497. 10.1016/J.NEUROIMAGE.2018.02.008